首页| 新闻| 娱乐| 游戏| 科普| 文学| 编程| 系统| 数据库| 建站| 学院| 产品| 网管| 维修| 办公| 热点
商业源码热门下载www.html.org.cn
练就火眼金睛 十一种常见电脑
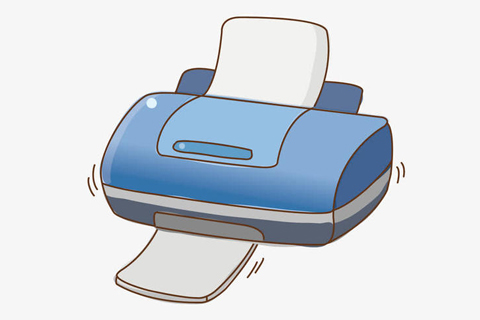
打印机共享提示“操作无法完成
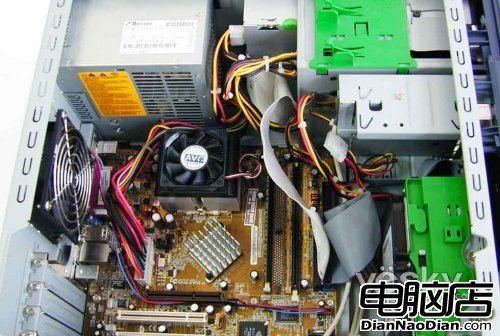
如何查找有故障的配件
回眸一笑百魅生,六宫粉黛无颜色
岁月静美,剪一影烟雨江南
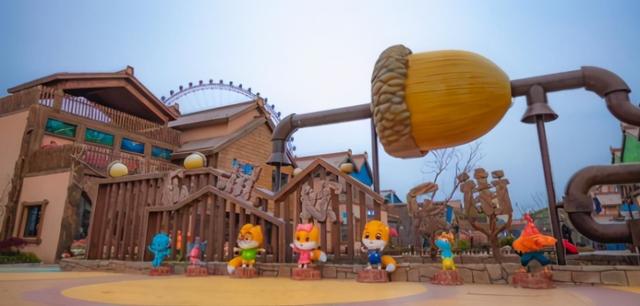
芜湖有个“松鼠小镇”
小满:小得盈满,一切刚刚好!
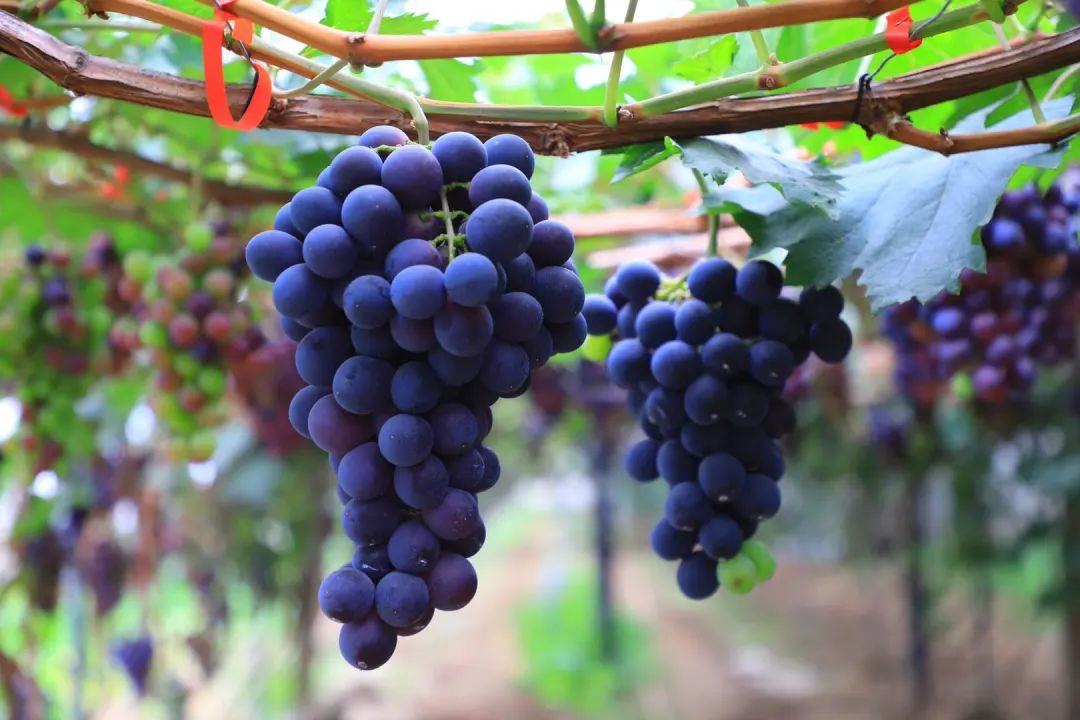
一串串晶莹剔透的葡萄,像一颗颗宝石挂在藤
正宗老北京脆皮烤鸭
人逢知己千杯少,喝酒搞笑图集
搞笑试卷,学生恶搞答题
新闻热点
疑难解答
图片精选
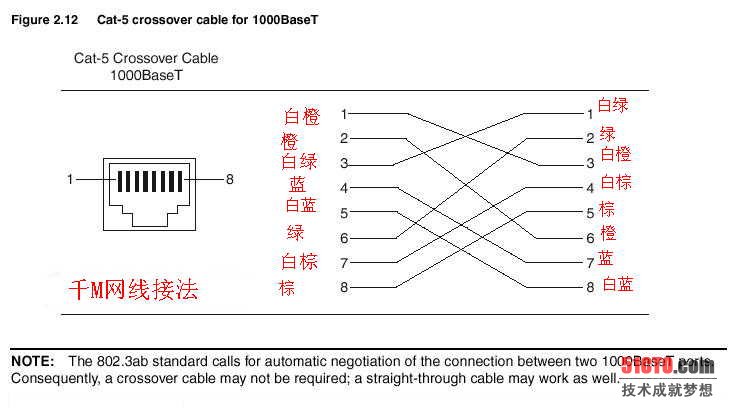
6类网线的完美接法
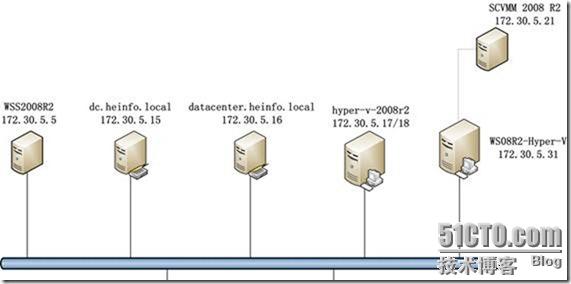
使用VMM2008 R2管理Hyper-V之1-实
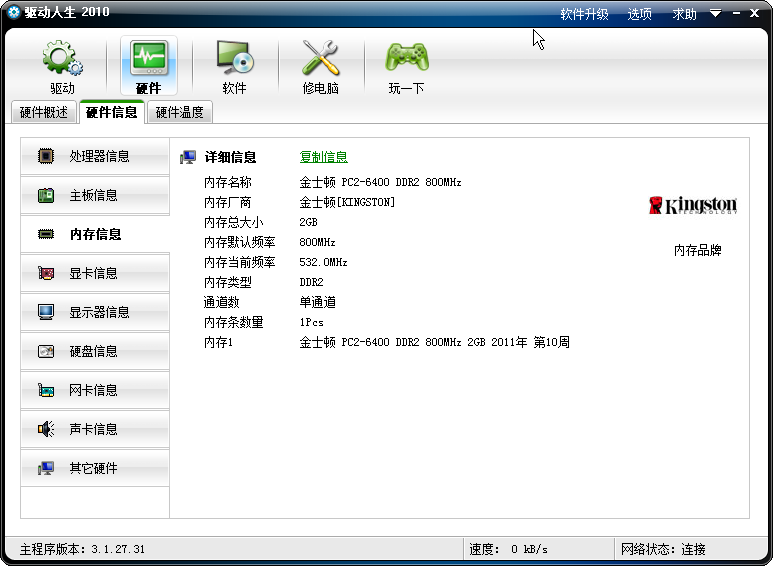
开机黑屏与内存的原因导致DDR2内存
Lua中基本的数据类型、表达式与流
网友关注