先给大家展示下效果图:
概述
现状
折线图的应用比较广泛,为了增强用户体验,很多应用中都嵌入了折线图。折线图可以更加直观的表示数据的变化。网络上有很多绘制折线图的demo,有的也使用了动画,但是线条颜色渐变的折线图的demo少之又少,甚至可以说没有。该Blog阐述了动画绘制线条颜色渐变的折线图的实现方案,以及折线图线条颜色渐变的实现原理,并附以完整的示例。
成果
本人已将折线图封装到了一个UIView子类中,并提供了相应的接口。该自定义折线图视图,基本上可以适用于大部分需要集成折线图的项目。若你遇到相应的需求可以直接将文件拖到项目中,调用相应的接口即可
项目文件中包含了大量的注释代码,若你的需求与折线图的实现效果有差别,那么你可以对项目文件的进行修改,也可以依照思路定义自己的折线图视图
Blog中涉及到的知识点
CALayer
图层,可以简单的看做一个不接受用户交互的UIView
每个图层都具有一个CALayer类型mask属性,作用与蒙版相似
Blog中主要用到的CALayer子类有
CAGradientLayer,绘制颜色渐变的背景图层
CAShapeLayer,绘制折线图
CAAnimation
核心动画的基类(不可实例化对象),实现动画操作
Quartz 2D
一个二维的绘图引擎,用来绘制折线(Path)和坐标轴信息(Text)
实现思路
折线图视图
整个折线图将会被自定义到一个UIView子类中
坐标轴绘制
坐标轴直接绘制到折线图视图上,在自定义折线图视图的 drawRect 方法中绘制坐标轴相关信息(线条和文字)
注意坐标系的转换
线条颜色渐变
失败的方案
开始的时候,为了实现线条颜色渐变,我的思考方向是,如何改变路径(UIBezierPath)的渲染颜色(strokeColor)。但是strokeColor只可以设置一种,所以最终无法实现线条颜色的渐变。
成功的方案
在探索过程中找到了CALayer的CALayer类型的mask()属性,最终找到了解决方案,即:使用UIView对象封装渐变背景视图(frame为折线图视图的减去坐标轴后的frame),创建一个CAGradientLayer渐变图层添加到背景视图上。
创建一个CAShapeLayer对象,用于绘制线条,线条的渲染颜色(strokeColor)为whiteColor,填充颜色(fillColor)为clearColor,从而显示出渐变图层的颜色。将CAShapeLayer对象设置为背景视图的mask属性,即背景视图的蒙版。
折线
使用 UIBezierPath 类来绘制折线
折线转折处尖角的处理,使用 kCALineCapRound 与 kCALineJoinRound 设置折线转折处为圆角
折线起点与终点的圆点的处理,可以直接在 UIBezierPath 对象上添加一个圆,设置远的半径为路径宽度的一半,从而保证是一个实心的圆而不是一个圆环
折线转折处的点
折线转折处点使用一个类来描述(不使用CGPoint的原因是:折线转折处的点需要放到一个数组中)
坐标轴信息
X轴、Y轴的信息分别放到一个数组中
X轴显示的是最近七天的日期,Y轴显示的是最近七天数据变化的幅度
动画
使用CABasicAnimation类来完成绘制折线图时的动画
需要注意的是,折线路径在一开始时需要社会线宽为0,开始绘制时才设置为适当的线宽,保证一开折线路径是隐藏的
标签
在动画结束时,向折线图视图上添加一个标签(UIButton对象),显示折线终点的信息
标签的位置,需要根据折线终点的位置计算
具体实现
折线转折处的点
使用一个类来描述折线转折处的点,代码如下:
// 接口/** 折线图上的点 */@interface IDLineChartPoint : NSObject/** x轴偏移量 */@property (nonatomic, assign) float x;/** y轴偏移量 */@property (nonatomic, assign) float y;/** 工厂方法 */+ (instancetype)pointWithX:(float)x andY:(float)y;@end// 实现@implementation IDLineChartPoint+ (instancetype)pointWithX:(float)x andY:(float)y {IDLineChartPoint *point = [[self alloc] init];point.x = x;point.y = y;return point;}@end自定义折线图视图
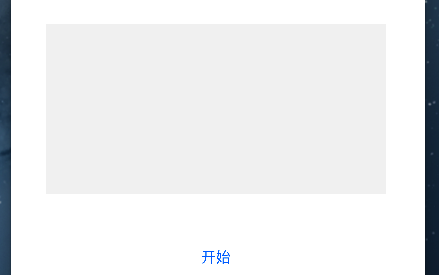
折线图视图是一个自定义的UIView子类,代码如下:
// 接口/** 折线图视图 */@interface IDLineChartView : UIView/** 折线转折点数组 */@property (nonatomic, strong) NSMutableArray<IDLineChartPoint *> *pointArray;/** 开始绘制折线图 */- (void)startDrawlineChart;@end// 分类@interface IDLineChartView ()@end// 实现@implementation IDLineChartView// 初始化- (instancetype)initWithFrame:(CGRect)frame {if (self = [super initWithFrame:frame]) {// 设置折线图的背景色self.backgroundColor = [UIColor colorWithRed:243/255.0 green:243/255.0 blue:243/255.0 alpha:1.0];}return self;}@end效果如图
绘制坐标轴信息
与坐标轴绘制相关的常量
/** 坐标轴信息区域宽度 */static const CGFloat kPadding = 25.0;/** 坐标系中横线的宽度 */static const CGFloat kCoordinateLineWith = 1.0;
在分类中添加与坐标轴绘制相关的成员变量
/** X轴的单位长度 */@property (nonatomic, assign) CGFloat xAxisSpacing;/** Y轴的单位长度 */@property (nonatomic, assign) CGFloat yAxisSpacing;/** X轴的信息 */@property (nonatomic, strong) NSMutableArray<NSString *> *xAxisInformationArray;/** Y轴的信息 */@property (nonatomic, strong) NSMutableArray<NSString *> *yAxisInformationArray;
与坐标轴绘制相关的成员变量的get方法
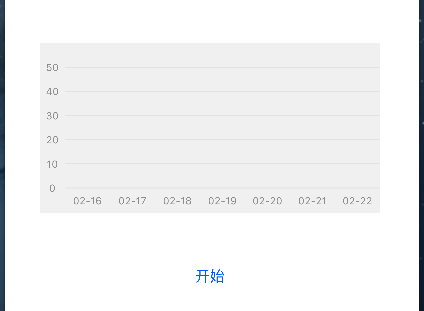
- (CGFloat)xAxisSpacing {if (_xAxisSpacing == 0) {_xAxisSpacing = (self.bounds.size.width - kPadding) / (float)self.xAxisInformationArray.count;}return _xAxisSpacing;}- (CGFloat)yAxisSpacing {if (_yAxisSpacing == 0) {_yAxisSpacing = (self.bounds.size.height - kPadding) / (float)self.yAxisInformationArray.count;}return _yAxisSpacing;}- (NSMutableArray<NSString *> *)xAxisInformationArray {if (_xAxisInformationArray == nil) {// 创建可变数组_xAxisInformationArray = [[NSMutableArray alloc] init];// 当前日期和日历NSDate *today = [NSDate date];NSCalendar *currentCalendar = [NSCalendar currentCalendar];// 设置日期格式NSDateFormatter *dateFormatter = [[NSDateFormatter alloc] init];dateFormatter.dateFormat = @"MM-dd";// 获取最近一周的日期NSDateComponents *components = [[NSDateComponents alloc] init];for (int i = -7; i<0; i++) {components.day = i;NSDate *dayOfLatestWeek = [currentCalendar dateByAddingComponents:components toDate:today options:0];NSString *dateString = [dateFormatter stringFromDate:dayOfLatestWeek];[_xAxisInformationArray addObject:dateString];}}return _xAxisInformationArray;}- (NSMutableArray<NSString *> *)yAxisInformationArray {if (_yAxisInformationArray == nil) {_yAxisInformationArray = [NSMutableArray arrayWithObjects:@"0", @"10", @"20", @"30", @"40", @"50", nil];}return _yAxisInformationArray;}绘制坐标轴的相关信息
- (void)drawRect:(CGRect)rect {// 获取上下文CGContextRef context = UIGraphicsGetCurrentContext();// x轴信息[self.xAxisInformationArray enumerateObjectsUsingBlock:^(NSString * _Nonnull obj, NSUInteger idx, BOOL * _Nonnull stop) {// 计算文字尺寸UIFont *informationFont = [UIFont systemFontOfSize:10];NSMutableDictionary *attributes = [NSMutableDictionary dictionary];attributes[NSForegroundColorAttributeName] = [UIColor colorWithRed:158/255.0 green:158/255.0 blue:158/255.0 alpha:1.0];attributes[NSFontAttributeName] = informationFont;CGSize informationSize = [obj sizeWithAttributes:attributes];// 计算绘制起点float drawStartPointX = kPadding + idx * self.xAxisSpacing + (self.xAxisSpacing - informationSize.width) * 0.5;float drawStartPointY = self.bounds.size.height - kPadding + (kPadding - informationSize.height) / 2.0;CGPoint drawStartPoint = CGPointMake(drawStartPointX, drawStartPointY);// 绘制文字信息[obj drawAtPoint:drawStartPoint withAttributes:attributes];}];// y轴[self.yAxisInformationArray enumerateObjectsUsingBlock:^(NSString * _Nonnull obj, NSUInteger idx, BOOL * _Nonnull stop) {// 计算文字尺寸UIFont *informationFont = [UIFont systemFontOfSize:10];NSMutableDictionary *attributes = [NSMutableDictionary dictionary];attributes[NSForegroundColorAttributeName] = [UIColor colorWithRed:158/255.0 green:158/255.0 blue:158/255.0 alpha:1.0];attributes[NSFontAttributeName] = informationFont;CGSize informationSize = [obj sizeWithAttributes:attributes];// 计算绘制起点float drawStartPointX = (kPadding - informationSize.width) / 2.0;float drawStartPointY = self.bounds.size.height - kPadding - idx * self.yAxisSpacing - informationSize.height * 0.5;CGPoint drawStartPoint = CGPointMake(drawStartPointX, drawStartPointY);// 绘制文字信息[obj drawAtPoint:drawStartPoint withAttributes:attributes];// 横向标线CGContextSetRGBStrokeColor(context, 231 / 255.0, 231 / 255.0, 231 / 255.0, 1.0);CGContextSetLineWidth(context, kCoordinateLineWith);CGContextMoveToPoint(context, kPadding, self.bounds.size.height - kPadding - idx * self.yAxisSpacing);CGContextAddLineToPoint(context, self.bounds.size.width, self.bounds.size.height - kPadding - idx * self.yAxisSpacing);CGContextStrokePath(context);}];}效果如图

渐变背景视图
在分类中添加与背景视图相关的常量
/** 渐变背景视图 */@property (nonatomic, strong) UIView *gradientBackgroundView;/** 渐变图层 */@property (nonatomic, strong) CAGradientLayer *gradientLayer;/** 颜色数组 */@property (nonatomic, strong) NSMutableArray *gradientLayerColors;
在初始化方法中添加调用设置背景视图方法的代码
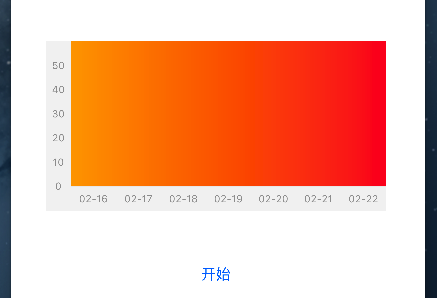
设置渐变视图方法的具体实现
- (void)drawGradientBackgroundView {// 渐变背景视图(不包含坐标轴)self.gradientBackgroundView = [[UIView alloc] initWithFrame:CGRectMake(kPadding, 0, self.bounds.size.width - kPadding, self.bounds.size.height - kPadding)];[self addSubview:self.gradientBackgroundView];/** 创建并设置渐变背景图层 *///初始化CAGradientlayer对象,使它的大小为渐变背景视图的大小self.gradientLayer = [CAGradientLayer layer];self.gradientLayer.frame = self.gradientBackgroundView.bounds;//设置渐变区域的起始和终止位置(范围为0-1),即渐变路径self.gradientLayer.startPoint = CGPointMake(0, 0.0);self.gradientLayer.endPoint = CGPointMake(1.0, 0.0);//设置颜色的渐变过程self.gradientLayerColors = [NSMutableArray arrayWithArray:@[(__bridge id)[UIColor colorWithRed:253 / 255.0 green:164 / 255.0 blue:8 / 255.0 alpha:1.0].CGColor, (__bridge id)[UIColor colorWithRed:251 / 255.0 green:37 / 255.0 blue:45 / 255.0 alpha:1.0].CGColor]];self.gradientLayer.colors = self.gradientLayerColors;//将CAGradientlayer对象添加在我们要设置背景色的视图的layer层[self.gradientBackgroundView.layer addSublayer:self.gradientLayer];}效果如图
折线
在分类中添加与折线绘制相关的成员变量
/** 折线图层 */@property (nonatomic, strong) CAShapeLayer *lineChartLayer;/** 折线图终点处的标签 */@property (nonatomic, strong) UIButton *tapButton;
在初始化方法中添加调用设置折线图层方法的代码
[self setupLineChartLayerAppearance];
设置折线图层方法的具体实现
- (void)setupLineChartLayerAppearance {/** 折线路径 */UIBezierPath *path = [UIBezierPath bezierPath];[self.pointArray enumerateObjectsUsingBlock:^(IDLineChartPoint * _Nonnull obj, NSUInteger idx, BOOL * _Nonnull stop) {// 折线if (idx == 0) {[path moveToPoint:CGPointMake(self.xAxisSpacing * 0.5 + (obj.x - 1) * self.xAxisSpacing, self.bounds.size.height - kPadding - obj.y * self.yAxisSpacing)];} else {[path addLineToPoint:CGPointMake(self.xAxisSpacing * 0.5 + (obj.x - 1) * self.xAxisSpacing, self.bounds.size.height - kPadding - obj.y * self.yAxisSpacing)];}// 折线起点和终点位置的圆点if (idx == 0 || idx == self.pointArray.count - 1) {[path addArcWithCenter:CGPointMake(self.xAxisSpacing * 0.5 + (obj.x - 1) * self.xAxisSpacing, self.bounds.size.height - kPadding - obj.y * self.yAxisSpacing) radius:2.0 startAngle:0 endAngle:2 * M_PI clockwise:YES];}}];/** 将折线添加到折线图层上,并设置相关的属性 */self.lineChartLayer = [CAShapeLayer layer];self.lineChartLayer.path = path.CGPath;self.lineChartLayer.strokeColor = [UIColor whiteColor].CGColor;self.lineChartLayer.fillColor = [[UIColor clearColor] CGColor];// 默认设置路径宽度为0,使其在起始状态下不显示self.lineChartLayer.lineWidth = 0;self.lineChartLayer.lineCap = kCALineCapRound;self.lineChartLayer.lineJoin = kCALineJoinRound;// 设置折线图层为渐变图层的maskself.gradientBackgroundView.layer.mask = self.lineChartLayer;}效果如图(初始状态不显示折线)
动画的开始与结束
动画开始
/** 动画开始,绘制折线图 */- (void)startDrawlineChart {// 设置路径宽度为4,使其能够显示出来self.lineChartLayer.lineWidth = 4;// 移除标签,if ([self.subviews containsObject:self.tapButton]) {[self.tapButton removeFromSuperview];}// 设置动画的相关属性CABasicAnimation *pathAnimation = [CABasicAnimation animationWithKeyPath:@"strokeEnd"];pathAnimation.duration = 2.5;pathAnimation.repeatCount = 1;pathAnimation.removedOnCompletion = NO;pathAnimation.fromValue = [NSNumber numberWithFloat:0.0f];pathAnimation.toValue = [NSNumber numberWithFloat:1.0f];// 设置动画代理,动画结束时添加一个标签,显示折线终点的信息pathAnimation.delegate = self;[self.lineChartLayer addAnimation:pathAnimation forKey:@"strokeEnd"];}动画结束,添加标签
/** 动画结束时,添加一个标签 */- (void)animationDidStop:(CAAnimation *)anim finished:(BOOL)flag {if (self.tapButton == nil) { // 首次添加标签(避免多次创建和计算)CGRect tapButtonFrame = CGRectMake(self.xAxisSpacing * 0.5 + ([self.pointArray[self.pointArray.count - 1] x] - 1) * self.xAxisSpacing + 8, self.bounds.size.height - kPadding - [self.pointArray[self.pointArray.count - 1] y] * self.yAxisSpacing - 34, 30, 30);self.tapButton = [[UIButton alloc] initWithFrame:tapButtonFrame];self.tapButton.enabled = NO;[self.tapButton setBackgroundImage:[UIImage imageNamed:@"bubble"] forState:UIControlStateDisabled];[self.tapButton.titleLabel setFont:[UIFont systemFontOfSize:10]];[self.tapButton setTitle:@"20" forState:UIControlStateDisabled];}[self addSubview:self.tapButton];}集成折线图视图
创建折线图视图
添加成员变量
/** 折线图 */@property (nonatomic, strong) IDLineChartView *lineCharView;
在viewDidLoad方法中创建折线图并添加到控制器的view上
self.lineCharView = [[IDLineChartView alloc] initWithFrame:CGRectMake(35, 164, 340, 170)];[self.view addSubview:self.lineCharView];
添加开始绘制折线图视图的按钮
添加成员变量
/** 开始绘制折线图按钮 */@property (nonatomic, strong) UIButton *drawLineChartButton;
在viewDidLoad方法中创建开始按钮并添加到控制器的view上
self.drawLineChartButton = [UIButton buttonWithType:UIButtonTypeSystem];self.drawLineChartButton.frame = CGRectMake(180, 375, 50, 44);[self.drawLineChartButton setTitle:@"开始" forState:UIControlStateNormal];[self.drawLineChartButton addTarget:self action:@selector(drawLineChart) forControlEvents:UIControlEventTouchUpInside];[self.view addSubview:self.drawLineChartButton];开始按钮的点击事件// 开始绘制折线图- (void)drawLineChart {[self.lineCharView startDrawlineChart];}好了,关于IOS绘制动画颜色渐变折线条就给大家介绍这么多,希望对大家有所帮助!
新闻热点


疑难解答