虽然说echo和print_r是公认的最实用的调试工具,但是效率真的没有可视化的直接断点那么高。这里简单介绍如果安装及配置xdebug for vscode
一、PHP环境处的配置
1、编译安装
下载及编译php,因为我所在的公司php版本是5.4的,所以去xdebug官网上选了相对比较底的版本.您也可以根据你们的实际情况下载相应的xdebug版本:https://xdebug.org/download.php
wget https://xdebug.org/files/xdebug-2.4.1.tgztar -xvf xdebug-2.4.1.tgzcd xdebug-2.4.1/phpize./configuremake install
make最终结束输出:
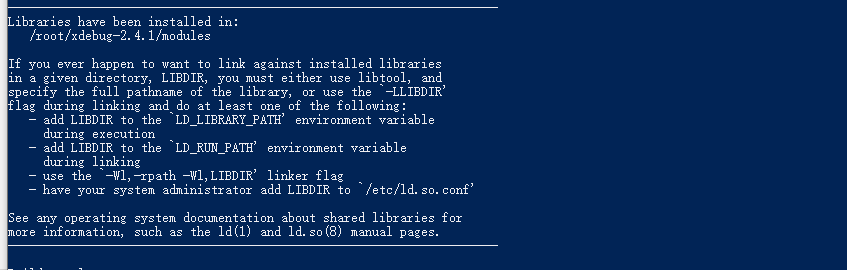
make install最终结束输出:
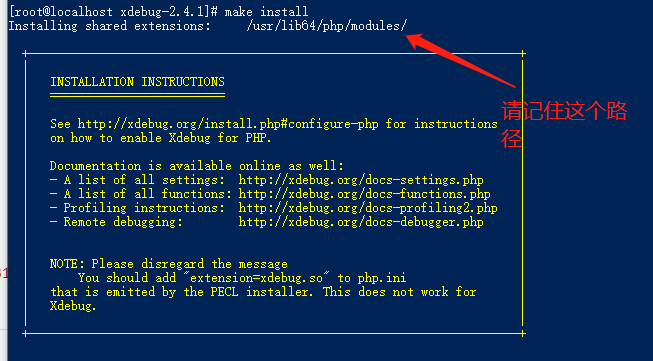
2、配置php.ini文件
这个是我的配置。为了使得可配性更强。我将xdebug配置写到:/etc/php.d/xdebug.ini
[Xdebug]zend_extension="/usr/lib64/php/modules/xdebug.so" #这里改成你在make install后的路径。xdebug.remote_enable = truexdebug.remote_host = 10.0.5.176 #改成你的vscode所以机器的ip地址#default port 9000xdebug.remote_port = 9000 #如果9000端口冲突了,可以换一个。不过相应的vscode配置也要相应的改变xdebug.profiler_enable = onxdebug.auto_trace = Onxdebug.show_exception_trace = Onxdebug.remote_autostart = Onxdebug.collect_vars = Onxdebug.collect_return = Onxdebug.remote_handler =dbgpxdebug.max_nesting_level = 10000xdebug.trace_output_dir = "D:/code/videochat" #我这里写的是php代码所在的路径
二、配置vscode
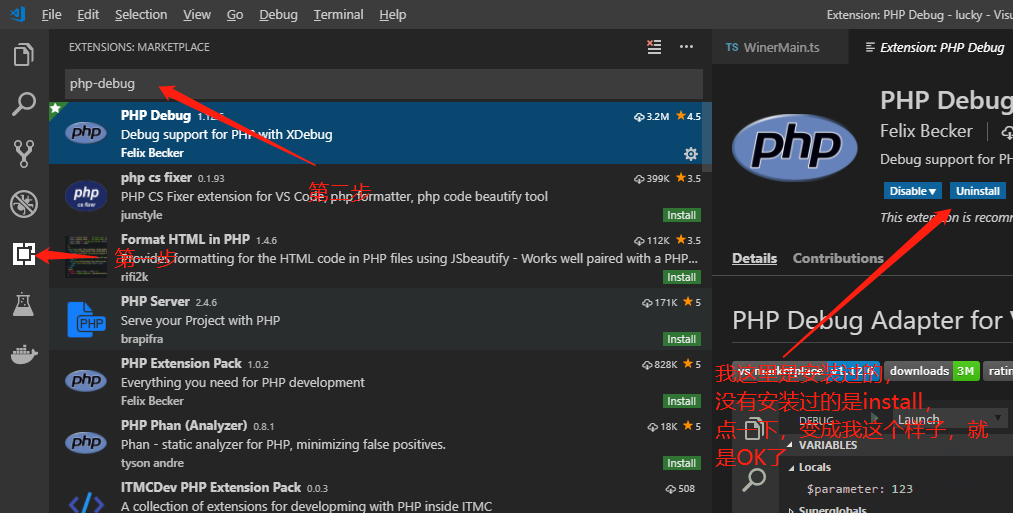
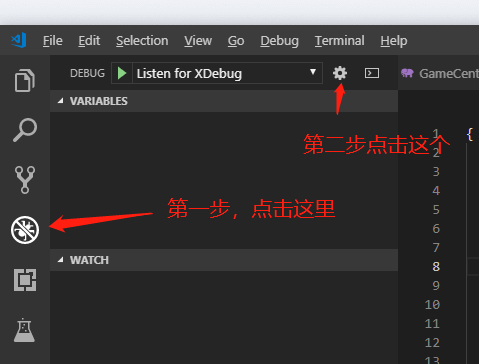
1、使用vscode打开php工程后。安装php-debug及生成调试配置文件,如图所示,依次点击这些按钮
2、如下操作后,会出现如下选项框。选中php即可
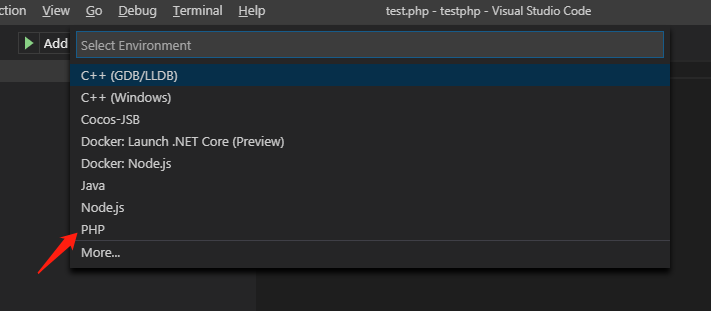
3、选中后,会出现一个json的配置文件
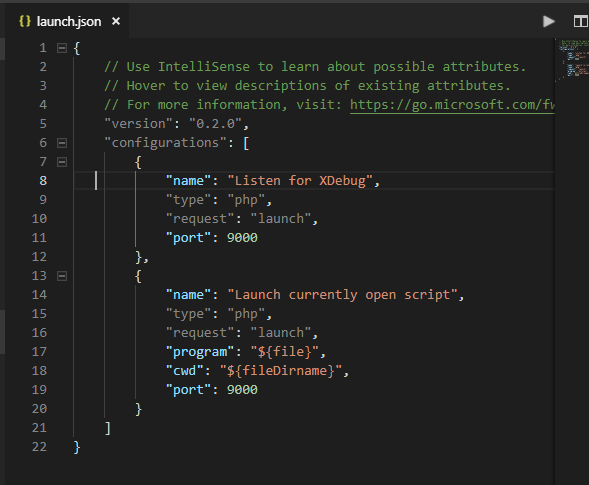
修改此json文件,注意serverSourceRoot改成你服务器上,php所在的路径。不然即使断下来后,会出现找不到文件的异常
{ // Use IntelliSense to learn about possible attributes. // Hover to view descriptions of existing attributes. // For more information, visit: https://go.microsoft.com/fwlink/?linkid=830387 "version": "0.2.0", "configurations": [ { "name": "Listen for XDebug", "type": "php", "request": "launch", "port": 9000, "stopOnEntry":false, "localSourceRoot": "${workspaceRoot}", "serverSourceRoot": "/work/videochat" }, { "name": "Launch currently open script", "type": "php", "request": "launch", "program": "${file}", "cwd": "${fileDirname}", "port": 9000 } ]}
新闻热点


疑难解答