案例:该数据集的是一个关于每个学生成绩的数据集,接下来我们对该数据集进行分析,判断学生是否适合继续深造
数据集特征展示
1 GRE 成绩 (290 to 340)2 TOEFL 成绩(92 to 120)3 学校等级 (1 to 5)4 自身的意愿 (1 to 5)5 推荐信的力度 (1 to 5)6 CGPA成绩 (6.8 to 9.92)7 是否有研习经验 (0 or 1)8 读硕士的意向 (0.34 to 0.97)
1.导入包
import numpy as npimport pandas as pdimport matplotlib.pyplot as pltimport seaborn as snsimport os,sys
2.导入并查看数据集
df = pd.read_csv("D://machine-learning//score//Admission_Predict.csv",sep = ",")
print('There are ',len(df.columns),'columns')
for c in df.columns:
 sys.stdout.write(str(c)+', '
There are 9 columnsSerial No., GRE Score, TOEFL Score, University Rating, SOP, LOR , CGPA, Research, Chance of Admit ,
一共有9列特征
df.info()
<class 'pandas.core.frame.DataFrame'>RangeIndex: 400 entries, 0 to 399Data columns (total 9 columns):Serial No.   400 non-null int64GRE Score   400 non-null int64TOEFL Score   400 non-null int64University Rating 400 non-null int64SOP     400 non-null float64LOR     400 non-null float64CGPA     400 non-null float64Research    400 non-null int64Chance of Admit  400 non-null float64dtypes: float64(4), int64(5)memory usage: 28.2 KB

数据集信息:
1.数据有9个特征,分别是学号,GRE分数,托福分数,学校等级,SOP,LOR,CGPA,是否参加研习,进修的几率
2.数据集中没有空值
3.一共有400条数据
# 整理列名称df = df.rename(columns={'Chance of Admit ':'Chance of Admit'})
# 显示前5列数据
df.head()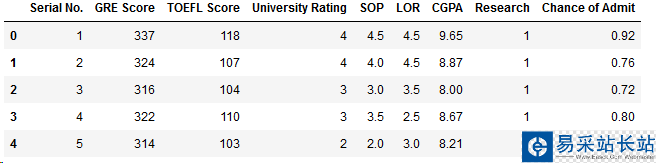
3.查看每个特征的相关性
fig,ax = plt.subplots(figsize=(10,10))sns.heatmap(df.corr(),ax=ax,annot=True,linewidths=0.05,fmt='.2f',cmap='magma')plt.show()
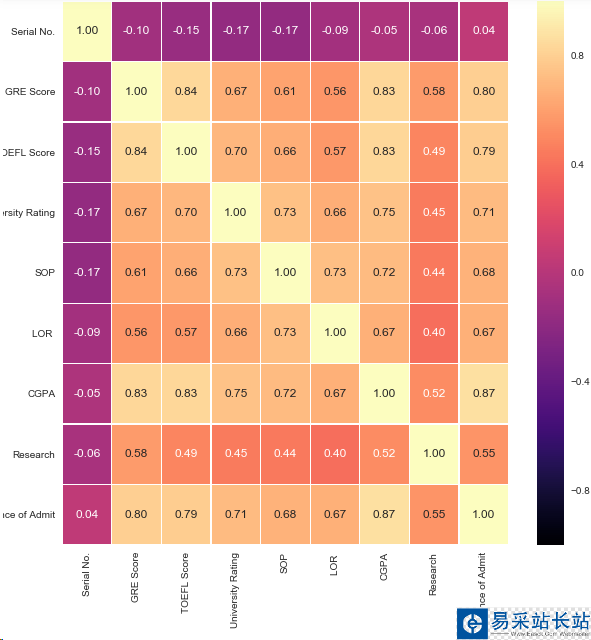
结论:1.最有可能影响是否读硕士的特征是GRE,CGPA,TOEFL成绩
2.影响相对较小的特征是LOR,SOP,和Research
4.数据可视化,双变量分析
4.1 进行Research的人数
print("Not Having Research:",len(df[df.Research == 0]))print("Having Research:",len(df[df.Research == 1]))y = np.array([len(df[df.Research == 0]),len(df[df.Research == 1])])x = np.arange(2)plt.bar(x,y)plt.title("Research Experience")plt.xlabel("Canditates")plt.ylabel("Frequency")plt.xticks(x,('Not having research','Having research'))plt.show()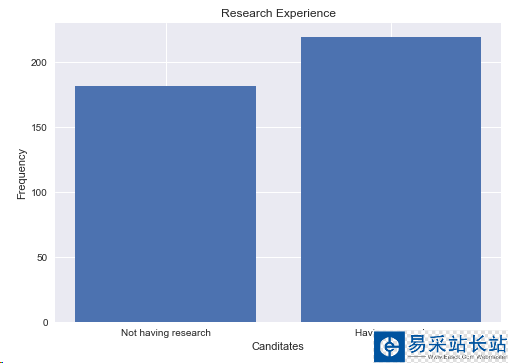
结论:进行research的人数是219,本科没有research人数是181
新闻热点


疑难解答