1.首先要绘制一个简单的条形图
import numpy as npimport matplotlib.pyplot as pltfrom matplotlib import mlabfrom matplotlib import rcParamsfig1 = plt.figure(2)rects =plt.bar(left = (0.2,1),height = (1,0.5),width = 0.2,align="center",yerr=0.000001)plt.title('Pe')plt.show()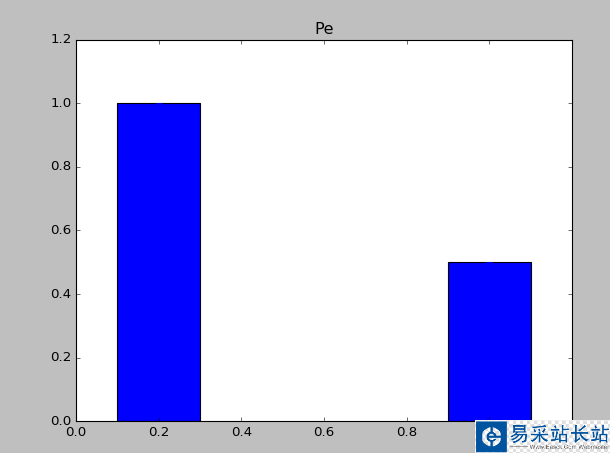
1.1上面中rects=plt.bar(left=(0.2,1),height=(1,0.5),width=0.2,align=”center”,yerr=0.000001)这句代码是最重要的,其中left表示直方图的开始的位置(也就是最左边的地方),height是指直方图的高度,当直方图太粗时,可以通过width来定义直方图的宽度,注意多个直方图要用元组,yerr这个参数是防止直方图触顶。
2.增加直方图脚注
import numpy as npimport matplotlib.pyplot as pltfrom matplotlib import mlabfrom matplotlib import rcParamsfig1 = plt.figure(2)rects =plt.bar(left = (0.2,1),height = (1,0.5),width = 0.2,align="center",yerr=0.000001)plt.title('Pe')plt.xticks((0.2,1),('frst','second'))plt.show()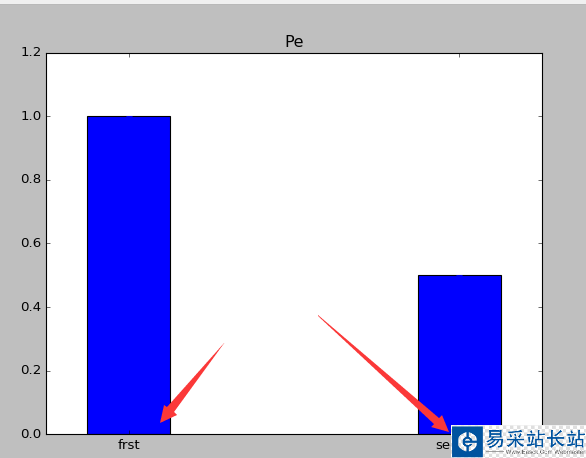
3.条形图上显示具体的数字(自动编号)
import numpy as npimport matplotlib.pyplot as pltfrom matplotlib import mlabfrom matplotlib import rcParamsfig1 = plt.figure(2)rects =plt.bar(left = (0.2,1),height = (1,0.5),width = 0.2,align="center",yerr=0.000001)plt.title('Pe')def autolabel(rects): for rect in rects: height = rect.get_height() plt.text(rect.get_x()+rect.get_width()/2., 1.03*height, '%s' % float(height))autolabel(rects)plt.xticks((0.2,1),('frst','second'))plt.show()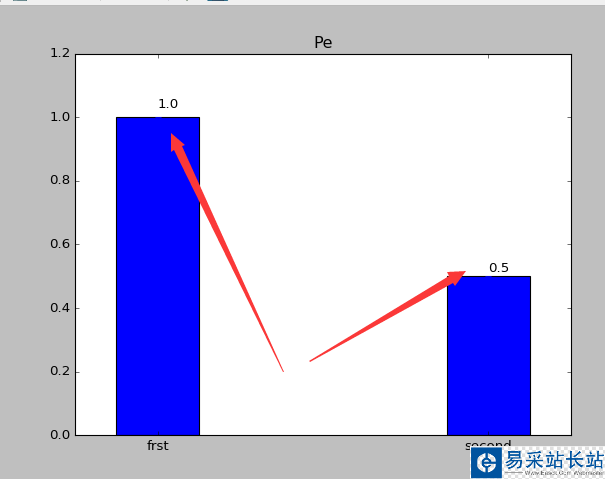
4.改变颜色
import numpy as npimport matplotlib.pyplot as pltfrom matplotlib import mlabfrom matplotlib import rcParamsfig1 = plt.figure(2)rects =plt.bar(left = (0.2,1),height = (1,0.5),color=('r','g'),width = 0.2,align="center",yerr=0.000001)plt.title('Pe')def autolabel(rects): for rect in rects: height = rect.get_height() plt.text(rect.get_x()+rect.get_width()/2., 1.03*height, '%s' % float(height))autolabel(rects)plt.xticks((0.2,1),('frst','second'))plt.show()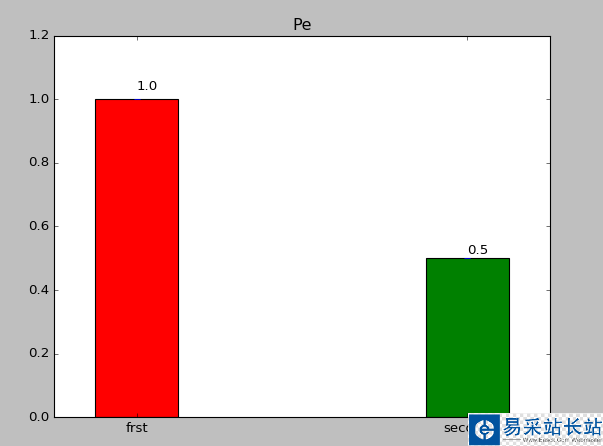
5.添加图注
import numpy as npimport matplotlib.pyplot as pltfrom matplotlib import mlabfrom matplotlib import rcParamsfig1 = plt.figure(2)rects1 =plt.bar(left = (0.2),height = (0.5),color=('g'),label=(('no1')),width = 0.2,align="center",yerr=0.000001)rects2 =plt.bar(left = (1),height = (1),color=('r'),label=(('no2')),width = 0.2,align="center",yerr=0.000001)plt.legend()plt.xticks((0.2,1),('frst','second'))plt.title('Pe')def autolabel(rects): for rect in rects: height = rect.get_height() plt.text(rect.get_x()+rect.get_width()/2., 1.03*height, '%s' % float(height))autolabel(rects1)autolabel(rects2)plt.show()
新闻热点


疑难解答