网上下载mayavi的官方帮助文档,里面有很多例子,下面的记录都是查看手册后得到的。
http://code.enthought.com/projects/mayavi/docs/development/latex/mayavi/mayavi_user_guide.pdf
python的mayavi.mlab库中的绘图函数有很多候选参数,但下文记录并没有过多讨论,本人也是需要用到才查看手册的。
安装好mayavi2的绘图环境后,可以结合numpy进行科学绘图,在代码中事先加入如下代码:
import mayavi.mlab as mlab from numpy import exp,sin,cos,tan,random,mgrid,ogrid,linspace,sqrt,pi import numpy as np import matplotlib.pyplot as plt mlab.figure(fgcolor=(0, 0, 0), bgcolor=(1, 1, 1)) #更改背景色 #添加matlab的peaks函数 def peaks(x,y): return 3.0*(1.0-x)**2*exp(-(x**2) - (y+1.0)**2) - 10*(x/5.0 - x**3 - y**5) * exp(-x**2-y**2) - 1.0/3.0*exp(-(x+1.0)**2 - y**2)
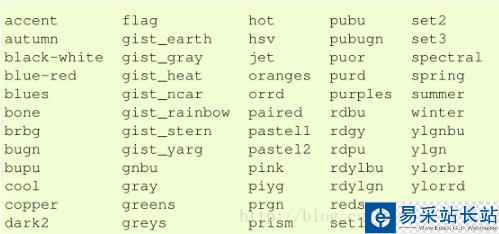
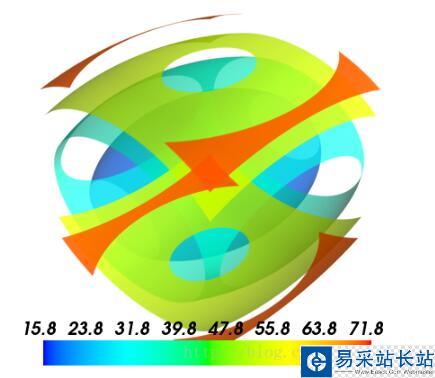
首先从帮助手册上了解下mayavi的colormap,如下图:
下面列举常用的三维绘图函数和简单例子。
一、barchart
* barchart(s, ...)
* barchart(x, y, s, ...)
* barchart(x, y, f, ...)
* barchart(x, y, z, s, ...)
* barchart(x, y, z, f, ...)
如果只传递一个参数,可以是一维(1-D),二维(2-D)或3维(3-D)的给定向量长度的数组;
如果传递三个参数(x,y,s)或(x,y,f),x,y是对应于数组s的二维(2-D)坐标,也可以是可调用的函数f,该函数返回数组;
四个参数的时候(x,y,z)表示三维坐标
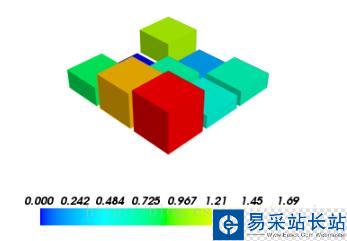
s = np.random.rand(3,3) mlab.barchart(s) mlab.vectorbar() mlab.show()
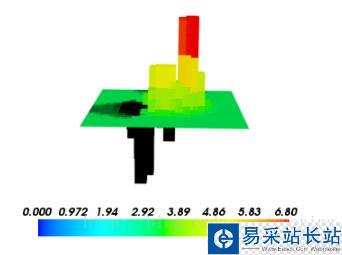
x,y = np.mgrid[-5:5:20j,-5:5:20j] s = peaks(x,y) #peaks函数前面已经定义 mlab.barchart(x,y,s) mlab.vectorbar() mlab.show()
二、contour3d
* contour3d(scalars, ...)
* contour3d(x, y, z, scalars, ...)
* contour3d(x, y, z, f, ...)
scalars是三维数组(3-D),x,y,z用numpy.mgrid生成,是三维数组
x, y, z = ogrid[-5:5:64j, -5:5:64j, -5:5:64j] scalars = x * x * 0.5 + y * y + z * z * 2.0 mlab.contour3d(scalars, contours=6, transparent=True) mlab.colorbar() mlab.show()
三、contour_surf
* contour_surf(s, ...)
* contour_surf(x, y, s, ...)
* contour_surf(x, y, f, ...)
s是二维数组,f是可调用的函数,例如peaks函数
x and y can be 1D or 2D arrays (such as returned by numpy.ogrid or numpy.mgrid)
新闻热点


疑难解答